
Real-Time Food Sensitivity Tracking: Beyond Guesswork Dieting
Food diaries rely on memory and IgG panels measure the wrong thing. See what the VOC and postprandial research actually shows, and how to build a tolerance map.
I once met someone who arrived carrying two binders. One was a year of meticulous food diary entries. The other was a stack of test results: IgG panels, stool analyses, breath tests, and printouts from three different tracking apps. Thousands of dollars of testing, and still no answer. Same meal, two different days, two completely different outcomes.
If you have ever tracked every bite for weeks and finished more confused than you started, you know the feeling. You cut gluten, then dairy, then eggs, then FODMAPs, and you are somehow still bloated at three in the afternoon. The elimination diet quietly became an elimination lifestyle, and you are running out of foods to blame.
Here is what the research keeps pointing to: the problem is not your discipline. It is your data.
Why the Standard Tools Fall Short
Let's be honest about the current state of food sensitivity testing.
The most heavily marketed option, IgG panels, sounds convincing. A blood draw, a colour-coded report, a clear list. Except the science does not support the interpretation. The EAACI Task Force concluded that testing for food-specific IgG4 is not recommended as a diagnostic tool, noting that positive results are common in people with no symptoms and that no controlled study establishes a diagnostic value for it (Stapel et al., Allergy, 2008). The AAAAI endorsed that position in 2010 and the CSACI reached the same conclusion in 2012 (Carr et al., Allergy, Asthma and Clinical Immunology, 2012). In plain terms, IgG tells you what you have been eating, not what is making you unwell. A CBC Marketplace investigation that sent one person's blood to two laboratories came back with 30 flagged foods from one and 52 from the other, with minimal overlap.
At-home microbiome sequencing is more scientifically grounded but answers a different question. Knowing which bacteria are present tells you about composition, not necessarily about whether those organisms are driving your symptoms or how they handled last night's dinner. A 2022 review concluded that microbiome analysis is not yet at the point where a stool profile translates into reliable individual food recommendations (Simon et al., Molecular Nutrition and Food Research, 2023). It is a photograph of an ecosystem, not a video of it.
Then there is the elimination diet, which, executed properly with professional guidance, remains one of the more reliable ways to identify genuine triggers. In a 2024 trial of 117 people with IBS, six weeks of dietitian-led low FODMAP elimination produced an 80 percent response rate, with mean symptom severity scores falling from 301 to 150 (Van den Houte et al., Gastroenterology, 2024). Properly is doing heavy lifting in that sentence. It means four to eight weeks of strict avoidance, then systematic single-food reintroduction every three to seven days, with meticulous tracking throughout, no accidental exposures, and reasonably stable stress and sleep. Most people cannot execute that perfectly outside a trial. That is not a character flaw. It is life.
The timing gap
This is where it gets genuinely difficult. IgE-mediated allergy typically produces symptoms within thirty minutes to two hours. The sensitivities most people wrestle with operate on a much longer clock, sometimes days.
Eat something Monday, feel it Wednesday. For anyone managing IBS-D or chronic digestive symptoms, this delay is maddening. You can eat the same meal two days running and react once, because your stress, sleep, or hormonal phase shifted the equation. Now identify the culprit among fifteen or twenty foods across those days using memory and a paper diary.
The human brain simply is not built to correlate events separated by days of intervening variables. That is the fundamental flaw in subjective tracking: you are attempting a complex biochemical puzzle with the tools of a to-do list.
What Is Happening Underneath
The gut barrier
Your intestinal lining is a single cell thick, and it has to absorb nutrients while excluding what should not cross. Tight junction proteins hold that structure together. When their regulation is disturbed, more food-derived material interacts with immune cells than usually would, which is one of the leading explanations for many food sensitivities. The food is not inherently the problem. The barrier is not performing as designed.
Work by Alessio Fasano identified the zonulin pathway as a key regulator of intestinal permeability, and described increased permeability as a contributing factor in the development of food sensitivities in susceptible individuals (Fasano, Annals of the New York Academy of Sciences, 2012). Controlled human work has since shown that acute psychological stress raises small intestinal permeability through a mast cell-dependent mechanism, reproduced by administering corticotropin-releasing hormone and blocked by a mast cell stabiliser (Vanuytsel et al., Gut, 2014). That is the physiological reason a stressful week changes what you can eat.
The microbial middlemen
The bacteria in your gut are not passive residents. They metabolize what you eat and produce volatile organic compounds (VOCs) as byproducts.
Different microbial communities generate different VOC profiles depending on what arrived, how well it was digested, and whether inflammation is present. Short-chain fatty acids such as butyrate, produced when beneficial bacteria ferment fiber, are among the best studied and serve as both fuel for intestinal cells and an indicator of healthy microbial activity. When the balance shifts, so does the profile: more hydrogen, methane, and sulfur compounds, less butyrate.
These shifts happen in real time, often before you notice anything. Which is the insight driving this whole field: your gut is already producing a continuous data stream about how it is handling your food. Until recently we had no practical way to read it outside a lab.
Why generic diets underperform
The degree of individual variation in food tolerance is remarkable, and it has been quantified. In a 2015 Cell study, researchers continuously monitored week-long glucose in 800 people across 46,898 meals and found variability in the response to identical meals large enough to conclude that universal dietary recommendations have limited utility (Zeevi et al., Cell, 2015). The PREDICT 1 study of 1,002 twins and unrelated adults put numbers on it: following identical meals, between-person variability was 68 percent for glucose, 59 percent for insulin, and 103 percent for blood triglyceride. For the fat response, the gut microbiome explained 7.1 percent of the variance while meal macronutrients explained 3.6 percent, and genetics contributed 9.5 percent to glucose predictions and under 1 percent to triglyceride (Berry et al., Nature Medicine, 2020).
Some of the variation is hardwired. Lactase persistence is a genetic trait rather than something to be fixed with gut healing, and lactase non-persistence is in fact the ancestral human state (Misselwitz et al., Gut, 2019). Copy number variation in the AMY1 gene influences how well people handle starch. Variation in bitter taste receptor genes shapes which plant compounds you find pleasant.
Layered on top of genetics, your microbial community, shaped by birth, early feeding, antibiotic history, and environment, determines a great deal of your metabolic response to any given meal. Across more than 10,000 participants in the American Gut Project, the number of distinct plant species eaten per week was among the strongest correlates of gut microbiome composition (McDonald et al., mSystems, 2018). That is why a low FODMAP approach transforms one person's IBS and does nothing for another, and why generic gut health advice, however well intended, fails so many people.
The Shift to Continuous Data
Reading the gut's chemical output
VOC analysis has been a research tool for decades. What has changed is the ability to capture it outside the laboratory.
Work published in Scientific Reports in 2024 demonstrated that non-invasive VOC monitoring can track how food components are metabolized by gut microbiota, with researchers incubating food substrates with stabilised human faecal samples and monitoring VOC output continuously over twenty-four hour periods, observing distinct signatures for different food compounds without disturbing the processes being measured.
What makes this approach interesting for food sensitivity work is its objectivity. Symptom diaries depend on your interpretation, and "am I bloated or just full" is a genuinely hard question at nine in the evening. Certain classes of VOCs, including organic acids and short-chain fatty acids, have been described in the literature as non-invasive indicators of gastrointestinal metabolic activity.
The clearest demonstration that this can carry real clinical information comes from the FODMAP field. In a 2024 eBioMedicine study, gas chromatography-mass spectrometry of the faecal headspace of 56 people with IBS, each paired with a household control, identified two metabotypes. One, designated IBS-P, showed a fermentative profile rich in short-chain fatty acids. Across 39 pairs who completed four weeks of a low FODMAP diet, that group showed significantly greater improvement in pain and overall symptoms than the other (Conley et al., eBioMedicine, 2024). The volatilome carried predictive information that a symptom diary could not.
From lab bench to bathroom
In 2025, researchers published results from a home-based passive electronic nose designed to monitor VOCs following bowel movements. It detected connections between dietary fiber intake and VOC output in a real home environment rather than a controlled laboratory (Sensors, 2025).
That is the leap that matters. The shift is from "come to the lab for a two-hour breath test" toward passive monitoring that fits into daily life without sample collection or effort. You eat, you live, and the tracking happens in the background.
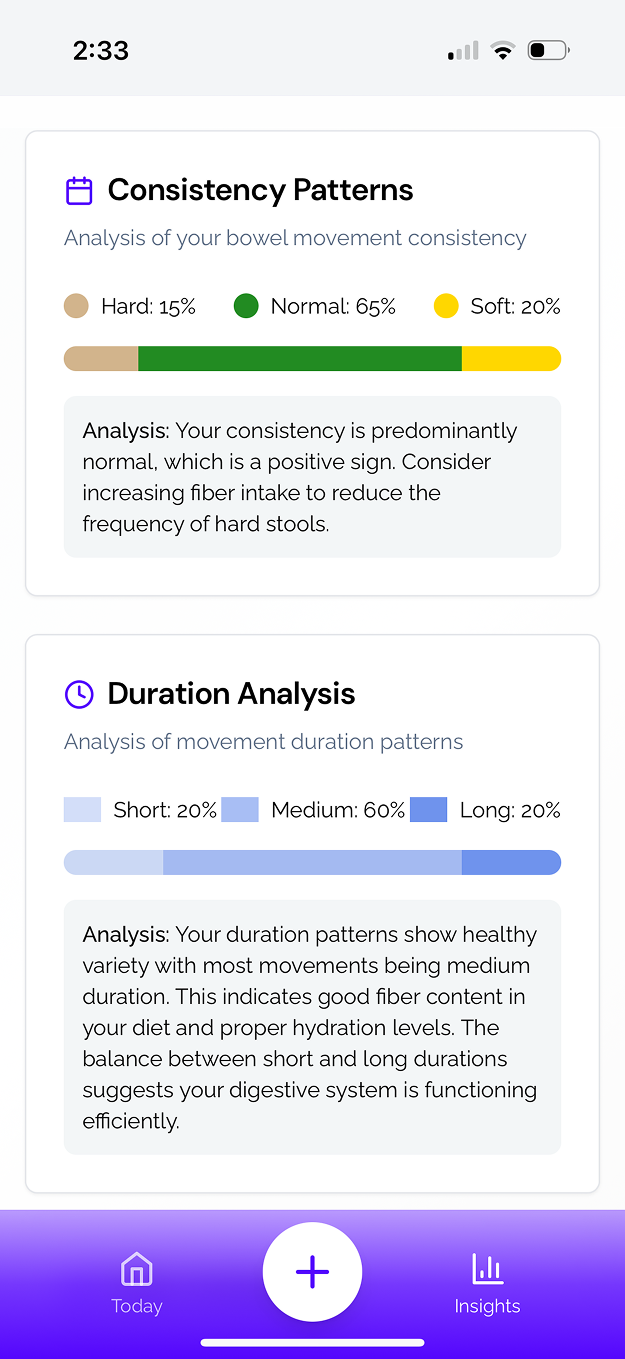
SNIFR is being developed in this space: passive at-home monitoring through VOC analysis, building a longitudinal picture of how your gut responds to food over weeks and months. It is a tool for surfacing patterns and supporting gut health optimization, not a diagnostic device, and it is designed to sit alongside professional care rather than replace it. Our pillar overview of food sensitivity detection through advanced gut health tracking explains how this fits with conventional testing.
Breath analysis
The breath testing space has advanced in parallel. Consumer devices now allow measurement of hydrogen and methane after specific meals, giving direct feedback on fermentation patterns, though they are not equivalent to a physician-ordered clinical breath test. Research platforms analyzing breath VOCs have identified established nutrition and microbiome-associated metabolites, including short-chain fatty acids, alongside candidate biomarkers of metabolic response to food. Combined with wearable sampling technologies, the direction of travel is clear: from periodic snapshots toward continuous streams.
A Practical Framework
Hypothetical scenario. As an illustrative scenario, imagine someone with IBS-D who has whittled her diet down to twelve safe foods over two years. Adding structured tracking to a dietitian-led protocol, the pattern that emerges over six weeks has nothing to do with the foods she has been avoiding. Her worst days follow late dinners at the end of demanding weeks, and the same meals eaten earlier on rested days pass without incident. That is entirely consistent with the controlled finding that acute psychological stress raises intestinal permeability through a mast cell-dependent mechanism. The answer for her is not fewer foods. It is better conditions. This scenario is constructed to illustrate the mechanism and does not describe a real user or any result produced by SNIFR.
That kind of insight is exactly what subjective tracking struggles to produce. Here is how to build toward it.
Step one: baseline, weeks one and two
Before hunting for problems, understand your normal. For two weeks, eat as you usually do and record what you eat and when, digestive symptoms with type, severity, and onset timing, bowel movements using the Bristol Stool Scale, sleep quality and stress, and any biomarker data you have available.
Without a baseline, you are comparing today against your memory of last week, which returns you to the guesswork problem.
Step two: find the timing patterns, weeks two to four
With frequent data points, look for temporal structure. Onset timing is diagnostic information in its own right.
| Response window | Likely mechanism | Typical examples | What identifies it |
|---|---|---|---|
| Under 2 hours | IgE-mediated allergy | Hives, swelling, wheezing, anaphylaxis | Allergist evaluation with skin prick testing, specific IgE and supervised oral food challenge. Not a tracking question. |
| 30 minutes to 3 hours | Enzymatic shortfall or malabsorption; histamine load exceeding DAO capacity | Lactose, fructose, aged and fermented foods | Physician-ordered hydrogen and methane breath testing; supervised low-histamine trial |
| 2 to 72 hours | Fermentation of malabsorbed carbohydrate; non-IgE immune activity | Fructans in wheat, onion and garlic; galacto-oligosaccharides in legumes | Structured reintroduction; continuous tracking, which is where delayed patterns are most often missed by memory |
| Dose-dependent, any window | Threshold effect rather than a binary reaction | Half an apple tolerated, a whole apple not; milk in coffee fine, a glass not | Graded challenges at increasing portions, which binary safe-or-unsafe lists cannot capture |
| Context-dependent, any window | Shifting barrier function, motility and immune reactivity | Same food tolerated in a calm week and not a hard one | Tracking that logs sleep, stress and menstrual phase alongside food |
Step three: build a tolerance map, weeks four to eight
For each suspected trigger, document the smallest amount that produces a noticeable response, the delay before it appears, whether preparation method changes anything, whether other foods at the same meal matter, and whether stress, sleep, or menstrual cycle shift the picture.
This is where personalized insights become genuinely practical. Rather than a can-eat and cannot-eat list, you build a nuanced understanding of the conditions under which each food works for you. The formal reintroduction data supports exactly this framing: in the 2024 Gastroenterology trial, responders reacted to an average of 2.5 FODMAP subtypes each rather than to the category as a whole.
Step four: adjust strategically, ongoing
With that map in hand, and ideally with a dietitian's input, the adjustments become specific: rotate foods sitting near your threshold rather than removing them, schedule challenging foods for when your patterns look most favourable, pay attention to combinations, adjust portions instead of eliminating, and periodically retest foods that previously caused problems as your gut healing progresses.
Where This Is Heading
The convergence of continuous monitoring and machine learning is opening up something genuinely new.
In 2024, researchers published the Gut Microbiome Wellness Index 2 in Nature Communications, a standardised, disease-agnostic health indicator derived from gut microbiome taxonomic profiles, which achieved 80 percent cross-validation balanced accuracy in distinguishing healthy from non-healthy individuals and gives a quantifiable benchmark that can be tracked over time. Findings presented at the 2024 Gut Microbiota for Health World Summit indicated that microbiome shifts often precede clinical flares, raising the possibility of acting before symptoms rather than after them.
Machine learning work on longitudinal microbiome data suggests individual community composition follows patterns predictable enough that anomalies can be flagged. Applied to food sensitivity, that points toward an early warning system rather than a post-mortem. It is worth being clear that this is an active research direction and a design intent, not a shipped capability, and no such performance has been demonstrated for SNIFR.
When to Involve a Professional
Tracking is a powerful tool and a poor substitute for clinical expertise. Data is most useful when someone qualified helps interpret it.
Seek guidance from a registered dietitian or physician when you have identified multiple sensitivities and need help maintaining nutritional adequacy, when your data shows patterns you cannot interpret, when symptoms persist or worsen despite changes, or when you have any history of disordered eating.
Seek medical evaluation promptly for blood in the stool, unintended weight loss, or debilitating pain, and for any suspicion of celiac disease, inflammatory bowel disease, or SIBO. If you are pregnant or breastfeeding, or managing sensitivities in a child, dietary changes should be led by your clinician.
A practitioner adds what tracking cannot: appropriate testing, identification of root causes beyond food, therapeutic protocols layered onto dietary insight, monitoring for nutrient deficiencies during restricted phases, and support through a process that is genuinely difficult. The most effective arrangement pairs continuous data with periodic clinical review. The tracking captures daily patterns. The clinician places them in the context of your history and goals.
The Bottom Line
The era of guesswork dieting has an expiry date. Eliminating food after food, wondering whether it was the eggs or the stress or the bad night's sleep, hoping the diary caught the right detail: that approach is being replaced by something better.
Continuous biomarker monitoring, VOC analysis, and pattern recognition are shifting food sensitivity work from subjective guesswork toward objective observation, from generic protocols toward personal tolerance maps, and from anxiety around eating toward empowerment through data.
Your gut has been communicating this information all along. We are finally building the tools to listen.
Frequently Asked Questions
What is real-time food sensitivity tracking?
It is continuous observation of how your gut responds to food, using objective signals such as volatile organic compounds produced by gut bacteria, alongside symptom and context logging. Unlike a food diary, which depends on memory, or a single blood test, which is a snapshot, continuous tracking captures delayed and dose-dependent patterns as they occur.
Why do food diaries fail to identify my triggers?
Because food sensitivity reactions are often delayed by two to seventy-two hours, and your brain is not built to correlate events separated by days of intervening variables. Between the delay, dose thresholds, and the influence of stress, sleep, and hormonal phase, a paper diary is being asked to solve a problem it was never designed for.
What is VOC analysis for gut health?
Volatile organic compounds are gases produced when gut bacteria metabolize what you eat. A 2024 Scientific Reports study monitored VOC output continuously over twenty-four hour periods and found distinct signatures for different food compounds, and a 2024 eBioMedicine study used faecal volatile profiling to identify IBS metabotypes that responded differently to a low FODMAP diet.
How much do individual responses to the same meal actually vary?
Substantially. In PREDICT 1, 1,002 participants eating identical meals showed 68 percent between-person variability in glucose, 59 percent in insulin and 103 percent in triglyceride response. The gut microbiome explained more of the fat response than the meal's macronutrients did. That is the quantitative case against generic food lists.
How long does it take to build a personal food tolerance map?
Plan on roughly eight weeks. The first two establish your baseline, weeks two to four reveal timing patterns, and weeks four to eight let you map thresholds, delays, preparation effects, and context. Working with a registered dietitian throughout makes the resulting map far more actionable than tracking alone.
Can food sensitivity tracking replace seeing a doctor?
No. Tracking surfaces patterns; it does not diagnose anything. Blood in the stool, unintended weight loss, or severe pain need prompt medical evaluation, as does any suspicion of celiac disease, inflammatory bowel disease, or SIBO. The most effective approach pairs continuous data with periodic review by a qualified clinician.
References
- Zeevi D, Korem T, Zmora N, et al. Personalized nutrition by prediction of glycemic responses. Cell. 2015;163(5):1079-1094. doi:10.1016/j.cell.2015.11.001
- Berry SE, Valdes AM, Drew DA, et al. Human postprandial responses to food and potential for precision nutrition. Nature Medicine. 2020;26(6):964-973. doi:10.1038/s41591-020-0934-0
- Conley TE, Slater R, Moss S, et al. Microbiome-driven IBS metabotypes influence response to the low FODMAP diet: insights from the faecal volatome. eBioMedicine. 2024;107:105282. doi:10.1016/j.ebiom.2024.105282
- Van den Houte K, Colomier E, Routhiaux K, et al. Efficacy and findings of a blinded randomized reintroduction phase for the low FODMAP diet in irritable bowel syndrome. Gastroenterology. 2024;167(2):333-342. doi:10.1053/j.gastro.2024.02.008
- Non-invasive VOCs detection to monitor the gut microbiota metabolism in vitro. Scientific Reports. 2024;14. doi:10.1038/s41598-024-66303-7
- Use of a novel passive e-nose to monitor fermentable prebiotic fiber consumption. Sensors. 2025;25(3):797. doi:10.3390/s25030797
- Gut Microbiome Wellness Index 2 enhances health status prediction from gut microbiome taxonomic profiles. Nature Communications. 2024;15. doi:10.1038/s41467-024-51651-9
- McDonald D, Hyde E, Debelius JW, et al. American Gut: an open platform for citizen science microbiome research. mSystems. 2018;3(3):e00031-18. doi:10.1128/mSystems.00031-18
- Fasano A. Zonulin, regulation of tight junctions, and autoimmune diseases. Annals of the New York Academy of Sciences. 2012;1258(1):25-33. doi:10.1111/j.1749-6632.2012.06538.x
- Vanuytsel T, van Wanrooy S, Vanheel H, et al. Psychological stress and corticotropin-releasing hormone increase intestinal permeability in humans by a mast cell-dependent mechanism. Gut. 2014;63(8):1293-1299. doi:10.1136/gutjnl-2013-305690
- Misselwitz B, Butter M, Verbeke K, Fox MR. Update on lactose malabsorption and intolerance: pathogenesis, diagnosis and clinical management. Gut. 2019;68(11):2080-2091. doi:10.1136/gutjnl-2019-318404
- Stapel SO, Asero R, Ballmer-Weber BK, et al. Testing for IgG4 against foods is not recommended as a diagnostic tool: EAACI Task Force Report. Allergy. 2008;63(7):793-796. doi:10.1111/j.1398-9995.2008.01705.x
- Carr S, Chan E, Lavine E, Moote W. CSACI position statement on the testing of food-specific IgG. Allergy, Asthma and Clinical Immunology. 2012;8(1):12. doi:10.1186/1710-1492-8-12
- Simon MC, Sina C, Ferrario PG, Daniel H. Gut microbiome analysis for personalized nutrition: the state of science. Molecular Nutrition and Food Research. 2023;67(1):e2200476. doi:10.1002/mnfr.202200476
- Academy of Nutrition and Dietetics. Are food sensitivity tests accurate?
- Cleveland Clinic. Food intolerance: causes, types and treatment options.
SNIFR is designed to provide insights about gut health patterns, not to diagnose or treat medical conditions. Individual results may vary as gut health is influenced by numerous factors including diet, stress, sleep, and genetics. SNIFR is currently in development, and features described may evolve before commercial release.
Other Posts



Be first to try SNIFR. Beta coming soon.
Join our waitlist to get notified when the app launches. Start understanding your gut health sooner.