
Hunger Signaling and Body Composition: Biohacker Protocol
How microbiome performance optimization shapes hunger signaling in hard training blocks, plus the protocol for tracking appetite as a real biomarker.

Most appetite advice is written for people trying to eat less. This is not that. If you are training seriously and managing body composition, the question is not how to suppress hunger. It is how to read the signal accurately so you can fuel a training block without either underrecovering or drifting off your composition targets.
Microbiome performance optimization is the part of that signal almost nobody instruments. You are tracking HRV, sleep architecture, and continuous glucose. But hunger and satiety are also outputs of a measurable system, and that system runs partly on bacterial metabolism.
Let's build the mechanism first, then the tracking protocol, then the intervention set.
The Mechanism: How Gut Bacteria Participate in Hunger Signaling
The gut brain axis is a bidirectional network linking the microbiome to the central nervous system through four channels: neural (vagus nerve), endocrine (gut peptides), immune (inflammatory signaling), and metabolic (microbial metabolites). Appetite regulation runs through all four. The current synthesis is that microbial metabolites including short-chain fatty acids, bile acids, and amino acid derivatives modulate nutrient sensing, neural signal transmission, and hormone secretion in the digestive tract (Yu et al., Gut Microbes, 2024).
Satiety peptides are partly bacterially modulated
Gut bacteria influence the release of peptide YY, GLP-1, and cholecystokinin from enteroendocrine cells. These peptides signal through vagal afferents and reach appetite-regulating circuits within minutes, which is far faster than any metabolite traveling through systemic circulation. Fetissov's review in Nature Reviews Endocrinology (2017) frames the gut microbiota as an active participant in host appetite control, with bacterial growth dynamics themselves linked to feeding behaviour, rather than as a passive bystander. A complementary evolutionary argument holds that gut microbes have both the means and the incentive to influence host eating behaviour toward substrates that favour their own growth (Alcock et al., BioEssays, 2014).
Short-chain fatty acids act on appetite pathways
Acetate, propionate, and butyrate are produced when bacteria ferment dietary fiber. Beyond their role in gut barrier and inflammatory signaling, SCFAs have direct effects on central appetite regulation: colonic acetate crosses the blood-brain barrier and produces a hypothalamic activation pattern consistent with appetite suppression (Frost et al., Nature Communications, 2014).
Propionate has the cleanest human dose-response data of the three. In a randomized study in overweight adults, 10 g per day of an inulin-propionate ester, which delivers roughly 2.4 g of propionate to the colon, acutely increased postprandial plasma PYY and GLP-1 and reduced ad libitum energy intake at a test meal (1013 kcal versus 1175 kcal on control). Over 24 weeks, the same 10 g daily dose significantly reduced weight gain, intra-abdominal adipose tissue, and intrahepatocellular lipid compared with the inulin control (Chambers et al., Gut, 2015). That is a real number attached to a real dose, and it is the closest thing in this literature to a controlled demonstration that raising colonic SCFA output changes eating behaviour.
For a self-quantifier, this matters because SCFA output is downstream of fiber choices you control directly, which makes it one of the most modifiable inputs in the entire stack.
Neurotransmitter production shifts food-seeking behavior
Bacterial populations participate in the synthesis and modulation of serotonin, dopamine, GABA, and glutamate. More than 90 percent of the body's serotonin sits in the gastrointestinal tract, and indigenous spore-forming bacteria regulate its synthesis by colonic enterochromaffin cells (Yano et al., Cell, 2015). Dopaminergic signaling in particular is tied to reward processing and food-seeking behavior. When a bacterial community is skewed toward species that thrive on refined carbohydrate, the resulting signaling profile biases food choice toward the substrate those species prefer. You are not fighting a character flaw. You are navigating an ecological system with its own incentives.
| Neurotransmitter | Associated bacterial producers | Gut contribution | Performance and appetite effects | Modifiable lever |
|---|---|---|---|---|
| Serotonin (5-HT) | Lactobacillus, Bifidobacterium; spore-formers regulate host synthesis | Over 90 percent of body 5-HT is in the GI tract (Yano et al., Cell, 2015) | Mood regulation, satiety signaling, cognitive flexibility | Fiber substrate, fermented foods, targeted strain trials |
| Dopamine | Bacillus, Escherichia coli, Proteus, Serratia | Measurable gut synthesis | Motivation, reward processing, food-seeking behaviour | Protein and tyrosine timing plus community composition |
| GABA | Bacteroides species | Principal inhibitory transmitter | Stress resilience, anxiety reduction, appetite modulation | Fermentable fiber protocols |
| Glutamate | Various microbiota | Principal excitatory transmitter | Synaptic plasticity, learning, cognitive performance | Overall community diversity |
Vagal tone gives you an existing readout
Roughly eighty percent of vagus nerve fibers are afferent, so information flows primarily from gut to brain (Cryan et al., Physiological Reviews, 2019). Vagal tone shows up in heart rate variability, which means the wearable already on your wrist is producing a partial proxy for gut brain axis function. That is the integration point that makes gut data useful rather than academic.
Why Appetite Signaling Breaks During Hard Training Blocks
Three things happen when volume goes up, and all three degrade the accuracy of your hunger signal.
- Energy demand rises faster than intake structure adapts. You need more total food, but your eating windows usually get shorter, not longer.
- Fiber gets crowded out. When calorie density becomes the priority, fermentable substrate is the first casualty. Less substrate means less SCFA production, which means less of the signaling that supports satiety.
- Intense training transiently increases intestinal permeability. That, combined with elevated cortisol and sleep debt, changes both the inflammatory environment and the bacterial populations operating in it.
The result is the pattern most athletes recognize: appetite that swings from absent to unmanageable within the same 24 hours, disproportionate cravings for refined carbohydrate, and body composition that drifts despite training load going up. Treating that as a willpower problem guarantees you never fix it.
Quantified Assessment: Making Appetite a Trackable Biomarker
Core gut health biomarkers
- Dietary diversity: 30 or more unique plant species per week, logged manually.
- Fiber intake: 40 to 50g daily from ten or more distinct sources if you are training hard, since intake scales with total calories.
- Fermented food frequency: two to three servings daily.
- Bristol Stool Scale: types 3 to 4, classified daily. Every serious tracker eventually accepts that the most informative daily data point is also the least dignified one.
- Transit time: roughly 12 to 24 hours, measured with a simple dye marker.
- Digestive symptom score: daily 1 to 10 rating.
| Category | Metric | Working target | Measurement method |
|---|---|---|---|
| Microbiome diversity | Dietary plant diversity | 30 or more unique species per week | Manual tracking log |
| Microbiome diversity | Fermented food frequency | 2 to 3 servings per day | Daily food log |
| Microbiome diversity | Fiber intake | 40 to 50 g daily from 10 or more sources | Nutrition tracking app |
| Digestive function | Bristol Stool Scale | Types 3 to 4 | Daily visual classification |
| Digestive function | Transit time | Roughly 12 to 24 hours | Food dye marker test |
| Digestive function | Bowel movement frequency | 1 to 3 complete eliminations daily | Daily tracking |
| Appetite signal | Pre-meal hunger rating | Recorded, not targeted | 1 to 10 immediately before eating |
| Appetite signal | Two-hour satiety rating | Recorded, not targeted | 1 to 10 two hours after the same meal |
| Appetite signal | Craving events | Count and category | Logged as they occur, never recalled at day end |
| Metabolic output | Postprandial energy | Stable, no crash | 1 to 10 at 2 to 4 hours after a high-fiber meal |
Appetite-specific metrics
- Pre-meal hunger rating: 1 to 10, recorded immediately before eating.
- Two-hour satiety rating: 1 to 10, recorded two hours after the same meal.
- Craving events: count and category, logged as they occur rather than recalled at the end of the day.
- Postprandial energy: 1 to 10 at two to four hours after a high-fiber meal.
Integrating with the stack you already run
Gut data earns its place by explaining variance in the metrics you already trust. That is the same integration principle that runs through advanced gut health optimization for biohackers: correlate first, then intervene on the strongest relationship.
HRV correlation protocol. Track HRV and gut metrics together for 14 days before changing anything. Then implement one intervention and watch the seven-day HRV trend, not single mornings. Diversity improvements generally take several weeks to appear in HRV because composition must shift before metabolite output shifts before vagal signaling shifts.
CGM correlation. Continuous glucose data is the fastest feedback channel for appetite work. Compare postprandial curves for identical repeated test meals, watch 24-hour glucose variability, and note dawn phenomenon magnitude. Craving events frequently cluster in the hours after a steep glucose excursion, and once you can see that on a chart it stops feeling mysterious.
Sleep architecture. Sleep debt degrades appetite signaling independently of anything happening in the gut, so it is a confounder you must control for. Log sleep efficiency and deep and REM percentages alongside hunger ratings before attributing an appetite change to a gut intervention.
Training load. Log session RPE and weekly volume. Hunger data without training load is uninterpretable, because the same rating means something different in a deload week than in a peak week.
Optimization Protocols
Protocol 1: SCFA production maximization
Objective: raise butyrate, propionate, and acetate output through targeted fiber manipulation.
Mechanism: specific resistant starches and non-digestible fibers selectively feed SCFA-producing bacteria including Faecalibacterium prausnitzii, Roseburia, Eubacterium, and Coprococcus.
Weeks 1 to 2: roughly 20g daily resistant starch type 2 from cooked and cooled potato, rice, or green banana. 10 to 15g daily inulin from Jerusalem artichoke, chicory root, or garlic. 5 to 10g daily beta-glucan from oats or mushrooms. Two to three daily pectin servings from apples, citrus, or carrots.
Weeks 3 to 6: progress resistant starch toward 30 to 40g daily as tolerance permits, add five to seven daily polyphenol servings, and integrate two to three daily fermented food servings.
Training-specific timing: concentrate fiber in the first part of the eating window and keep high-fiber loads away from the two to three hours immediately preceding a hard session. Fermentation and intensity do not cooperate.
Note on the propionate literature. The 10 g per day inulin-propionate ester used by Chambers and colleagues is a research compound, not a supplement to source yourself. It is cited here because it establishes the causal direction, that raising colonic propionate raises PYY and GLP-1 and lowers energy intake. The practical version of that mechanism is food-based fermentable fiber.
Protocol 2: bacterial diversity enhancement
Objective: raise microbiome diversity through systematic plant variety, because diverse communities are more resilient to the disruption a training block imposes.
- Minimum: 30 distinct plant species weekly
- Optimal: 40 to 50 weekly
- Advanced: 60 or more weekly
Count varieties separately. Rotate seven breakfast bases, build lunches from eight to twelve plant ingredients, use three to five spices daily, and cycle through ten or more nuts, seeds, and fruits. The 30-plant target comes from the American Gut Project, which found that the number of unique plant species a person eats associated with microbial diversity more strongly than self-reported diet labels did, and that participants eating more than 30 plant types per week differed measurably from those eating 10 or fewer (McDonald et al., mSystems, 2018).
Protocol 3: circadian alignment for appetite stability
Mechanism: gut bacteria oscillate across the day. Erratic meal timing effectively imposes jet lag on the microbiome, and inconsistent timing is one of the more reliable ways to destabilize hunger signaling.
- Compress the feeding window to 8 to 10 hours where training schedule allows.
- Place the largest meal within four hours of waking, skewing carbohydrate earlier and fat later.
- Deliver roughly 60 percent of daily fiber in the first two meals.
- 25 to 40g protein within 90 minutes of waking, which supports satiety across the whole day rather than just the next hour.
| Time of day | Protocol element | Specific action | Signal being targeted |
|---|---|---|---|
| On waking | Assessment | HRV measurement, readiness rating 1 to 10, gut function check | Baseline data collection |
| First 90 minutes | Optimization nutrition | 25 to 40 g protein, 10 to 15 g resistant starch, probiotic if running one | All-day satiety, catecholamine substrate |
| 2 to 4 hours post-breakfast | Cognitive and training peak | Hardest mental or technical work, light movement, hydration | Metabolic peak state |
| Afternoon | Maintenance | High-diversity lunch of 8 to 12 plants, 10 to 15 minute post-meal walk | Glycemic control, vagal tone |
| 3 to 4 hours pre-sleep | Wind-down | Dinner with tryptophan sources and fermented foods, blue light minimized | Serotonin conversion, overnight bacterial activity |
| Pre-sleep | Final assessment | Evening HRV check, gut symptom review, next-day hunger rating baseline | Sleep readiness and appetite trend |
Protocol 4: strategic probiotic testing
Published trials name both strain and dose, which means you can replicate the exposure instead of guessing at it. The doses below are as studied, not recommendations.
| Strain | Dose as studied | Study design | Reported direction | Timing |
|---|---|---|---|---|
| Lactiplantibacillus plantarum PS128 | 3 x 10^10 CFU per day, 4 weeks | Randomized, double-blind, placebo-controlled (Liu et al., Nutrients, 2019) | Behavioural subscale changes in the younger cohort; dopaminergic and stress-reactivity mechanisms proposed | Once daily, with food |
| Bifidobacterium longum 1714 | 1 x 10^9 CFU per day, 4 weeks | Within-participants translational study, 22 healthy volunteers (Allen et al., Translational Psychiatry, 2016) | Attenuated cortisol output and subjective anxiety to an acute stressor | Daily |
| Akkermansia muciniphila, pasteurized | 10^10 bacteria per day, 3 months | Randomized, double-blind, placebo-controlled pilot, 32 completers (Depommier et al., Nature Medicine, 2019) | Insulin sensitivity +28.6 percent, insulinemia -34.1 percent | Daily, with a meal |
| Faecalibacterium prausnitzii | Not supplemented; fed via substrate | Observational and mechanistic literature | Major butyrate producer, associated with anti-inflammatory tone | Feed with inulin, resistant starch, polyphenols |
- Weeks 1 to 4: a single strain only, so any response is attributable.
- Weeks 5 to 8: add a second strain while holding prebiotic intake steady at 30 to 40g daily.
- Weeks 9 onward: keep what moved a tracked metric, drop what did not.
Use third-party tested products with named strains and verified CFU counts, take them with meals, and remember that a probiotic without fiber substrate has nothing to eat. Temper expectations at the category level: an umbrella review of meta-analyses of prebiotic, probiotic, and synbiotic supplementation for overweight and obesity indicators found effects that were statistically detectable but modest, and heavily dependent on strain, dose, and population (Rasaei et al., Frontiers in Endocrinology, 2024). Supplements are not the lever. Substrate is.
Population-Specific Adjustments
Endurance and high-volume athletes
Fiber targets scale with caloric intake, so 50 to 60g daily is often appropriate. Keep high-fiber meals away from pre-workout windows, increase fermented food intake during intensive blocks, and expect transient permeability changes after very hard sessions to show up in digestive symptom scores.
Strength and body composition focus
Protein timing does most of the satiety work, but fiber determines whether that satiety holds through the afternoon. During a cut, defend plant diversity even as total calories fall, since diversity is usually the first thing lost when the budget tightens.
Low-carb and ketogenic protocols
Very low carbohydrate intake reduces fermentable substrate and can compress SCFA production. If metabolic flexibility is the goal, treat fiber as a deliberately defended variable using non-starchy sources such as psyllium husk, chia, and low-carbohydrate vegetables, and track diversity and tolerance carefully through the transition.
Troubleshooting
- No change in cravings after four to six weeks. Fiber is probably still too low and diversity too narrow. Push toward 40 to 50g and 30-plus species, ensure water intake keeps pace, and check whether refined carbohydrate is still entering daily.
- Digestive discomfort persists or worsens. The ramp is too fast. Cut back to current tolerance and increase by roughly 5g weekly, favoring easily fermented resistant starch initially. If it continues past four weeks, involve a clinician rather than pushing harder.
- Benefits fade after initial improvement. Audit adherence against the original protocol, check for antibiotic or medication changes, and look at whether a stress or travel period disrupted the routine. Microbiome composition responds to renewed adherence, so treat it as a setback rather than a failure.
- Metrics improve but body composition does not move. Appetite signaling is one input among many. Verify training load, protein intake, and sleep before attributing anything to the gut.
Hypothetical scenario. As an illustrative scenario, imagine a triathlete entering a twelve-week build. Weekly volume rises 40 percent, eating windows compress, and her logged plant count falls from 28 species to 14 while daily fiber drops from 45 g to 22 g. Craving events cluster in the two hours after her highest glucose excursions. The mechanistic prediction is straightforward: less fermentable substrate means less SCFA production, and propionate and acetate are exactly the metabolites shown to raise PYY and GLP-1 and lower energy intake in controlled work (Chambers et al., Gut, 2015; Frost et al., Nature Communications, 2014). The corrective experiment is to restore fiber and diversity while holding training load fixed, and to judge it on four-week averages. This scenario is illustrative and is not a described result.
Key Performance Insights
- Hunger is a measurable signal, not a character trait. Rate it, log it against training load, and review weekly.
- SCFA output is downstream of fiber choices, which makes it the most directly modifiable lever in the appetite stack. Raising colonic propionate raised PYY and GLP-1 and lowered ad libitum intake in controlled human work (Chambers et al., Gut, 2015).
- Fiber is the first casualty of a high-volume block and the variable most worth defending.
- Sleep and training load are confounders. Control for them before crediting a gut intervention.
- Supplement-category effects on weight indicators are modest at best (Rasaei et al., Frontiers in Endocrinology, 2024). Substrate and diversity do the heavy lifting.
- Single-variable, four-week trials produce interpretable data. Stacked changes do not.
Frequently Asked Questions
Can gut bacteria really affect how hungry I feel during a training block?
Yes. Gut bacteria influence the release of satiety peptides such as PYY, GLP-1, and CCK, and they generate short-chain fatty acids that act on appetite-regulating pathways. During a heavy training block, when energy demand and inflammatory load both rise, those signals shift. Tracking hunger ratings alongside training load makes the pattern visible instead of anecdotal.
Why do my cravings spike when I increase training volume?
Higher volume raises energy demand and often compresses eating windows, which reduces fiber intake and substrate for fermentation. Lower substrate means lower short-chain fatty acid output, and SCFAs participate in satiety signaling. Combined with sleep debt and elevated cortisol, that produces the classic high-volume craving spike, which is a fueling and signaling problem rather than a discipline problem.
How do I track appetite as a biomarker instead of guessing?
Rate hunger on a one to ten scale immediately before and two hours after each meal, log it against training load, sleep, and plant species count, then review weekly averages rather than daily numbers. Paired with continuous glucose data, this turns a subjective experience into a trend you can correlate with specific interventions.
How long does it take for gut interventions to change appetite signaling?
Most self-experimenters need four to eight weeks. Dietary changes shift bacterial composition first, then metabolite production, then hormonal and neural signaling. Expect the first two weeks to feel worse rather than better as fiber intake rises, and judge the protocol on week four onward rather than on the first uncomfortable fortnight.
Does a ketogenic or low-carb approach hurt appetite regulation through the microbiome?
It can, because very low carbohydrate intake reduces the fermentable substrate that SCFA-producing bacteria depend on. If you are running a low-carb protocol for metabolic flexibility, fiber becomes the variable to defend deliberately through non-starchy sources such as psyllium, chia, and low-carb vegetables. Track diversity and digestive tolerance closely through the transition.
What are the best gut health biomarkers for biohackers tracking body composition?
Start with plant species per week, daily fiber grams from distinct sources, Bristol Stool Scale type, transit time, and pre and post-meal hunger ratings. Layer those onto the data you already collect: HRV, sleep architecture, continuous glucose variability, and training load. The value comes from correlation across streams, not from any single gut number.
Is there direct human evidence that short-chain fatty acids reduce food intake?
Yes, for propionate specifically. In overweight adults, 10 g per day of an inulin-propionate ester delivering about 2.4 g of propionate to the colon acutely raised PYY and GLP-1 and cut ad libitum intake at a test meal from about 1175 to 1013 kcal, and over 24 weeks reduced weight gain and intra-abdominal fat versus an inulin control (Chambers et al., Gut, 2015).
References
- Fetissov SO. Role of the gut microbiota in host appetite control: bacterial growth to animal feeding behaviour. Nature Reviews Endocrinology. 2017;13(1):11-25. doi:10.1038/nrendo.2016.150
- Yu M, Yu B, Chen D. The effects of gut microbiota on appetite regulation and the underlying mechanisms. Gut Microbes. 2024;16(1):2414796. doi:10.1080/19490976.2024.2414796
- Han H, Yi B, Zhong R, et al. From gut microbiota to host appetite: gut microbiota-derived metabolites as key regulators. Microbiome. 2021;9(1):162. doi:10.1186/s40168-021-01093-y
- Silva YP, Bernardi A, Frozza RL. The Role of Short-Chain Fatty Acids From Gut Microbiota in Gut-Brain Communication. Frontiers in Endocrinology. 2020;11:25. doi:10.3389/fendo.2020.00025
- Mansuy-Aubert V, Ravussin Y. Short chain fatty acids: the messengers from down below. Frontiers in Neuroscience. 2023;17:1197759. doi:10.3389/fnins.2023.1197759
- Frost G, Sleeth ML, Sahuri-Arisoylu M, et al. The short-chain fatty acid acetate reduces appetite via a central homeostatic mechanism. Nature Communications. 2014;5:3611. doi:10.1038/ncomms4611
- Chambers ES, Viardot A, Psichas A, et al. Effects of targeted delivery of propionate to the human colon on appetite regulation, body weight maintenance and adiposity in overweight adults. Gut. 2015;64(11):1744-1754. doi:10.1136/gutjnl-2014-307913
- Alcock J, Maley CC, Aktipis CA. Is eating behavior manipulated by the gastrointestinal microbiota? Evolutionary pressures and potential mechanisms. BioEssays. 2014;36(10):940-949. doi:10.1002/bies.201400071
- Rasaei N, Heidari M, Esmaeili F, et al. The effects of prebiotic, probiotic or synbiotic supplementation on overweight/obesity indicators: an umbrella review of the trials' meta-analyses. Frontiers in Endocrinology. 2024;15:1277921. doi:10.3389/fendo.2024.1277921
- Yano JM, Yu K, Donaldson GP, et al. Indigenous Bacteria from the Gut Microbiota Regulate Host Serotonin Biosynthesis. Cell. 2015;161(2):264-276. doi:10.1016/j.cell.2015.02.047
- Cryan JF, O'Riordan KJ, Cowan CSM, et al. The Microbiota-Gut-Brain Axis. Physiological Reviews. 2019;99(4):1877-2013. doi:10.1152/physrev.00018.2018
- McDonald D, Hyde E, Debelius JW, et al. American Gut: an Open Platform for Citizen Science Microbiome Research. mSystems. 2018;3(3):e00031-18. doi:10.1128/mSystems.00031-18
- Liu YW, Liong MT, Chung YE, et al. Effects of Lactobacillus plantarum PS128 on Children with Autism Spectrum Disorder in Taiwan: A Randomized, Double-Blind, Placebo-Controlled Trial. Nutrients. 2019;11(4):820. doi:10.3390/nu11040820
- Allen AP, Hutch W, Borre YE, et al. Bifidobacterium longum 1714 as a translational psychobiotic: modulation of stress, electrophysiology and neurocognition in healthy volunteers. Translational Psychiatry. 2016;6(11):e939. doi:10.1038/tp.2016.191
- Depommier C, Everard A, Druart C, et al. Supplementation with Akkermansia muciniphila in overweight and obese human volunteers: a proof-of-concept exploratory study. Nature Medicine. 2019;25(7):1096-1103. doi:10.1038/s41591-019-0495-2
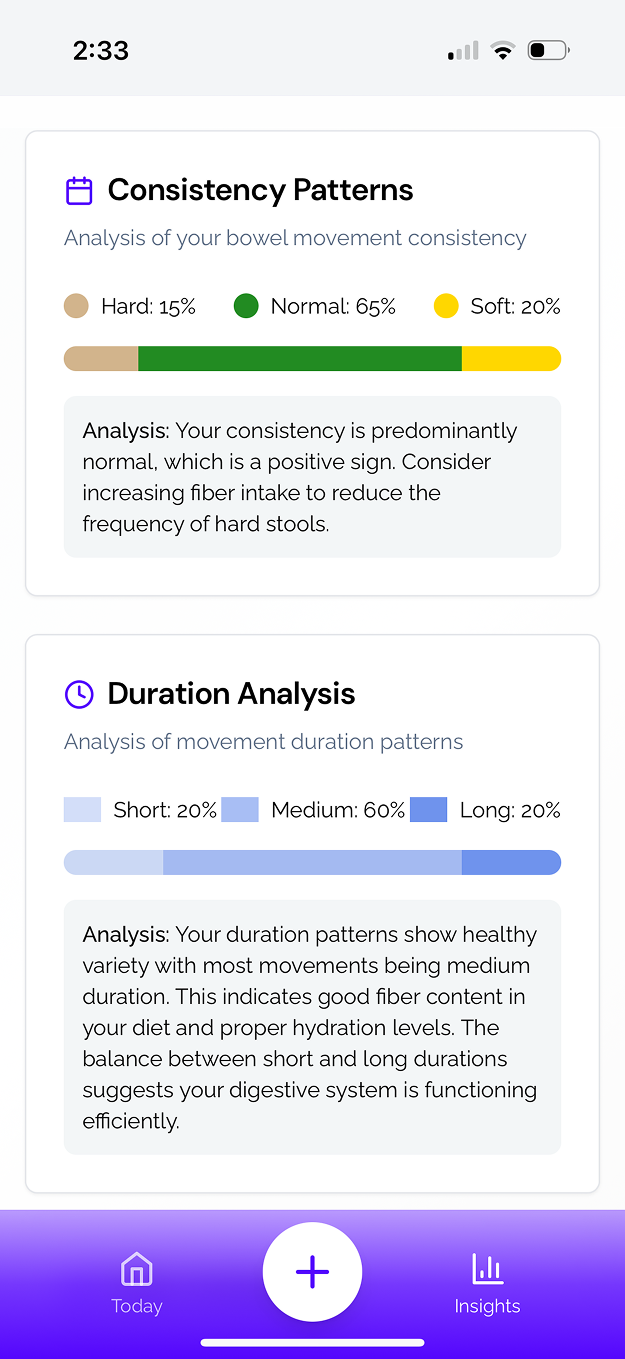
SNIFR is designed to provide insights about gut health patterns, not to diagnose or treat medical conditions. Individual results may vary as gut health is influenced by numerous factors including diet, stress, sleep, and genetics. SNIFR is currently in development, and features described may evolve before commercial release.
Other Posts



Be first to try SNIFR. Beta coming soon.
Join our waitlist to get notified when the app launches. Start understanding your gut health sooner.