
Digestive Wellness Signals That Predict Weight Management Success
Fifteen digestive wellness signals, from stool consistency to satiety response, that research links to weight management success, and how to read your own.

What if your gut could tell you whether your next dietary change will actually stick?
For years, weight management advice has focused on the same three levers: fewer calories, more exercise, less bread. But a growing body of research points to something more predictive than any meal plan. Your digestive system broadcasts signals that appear to forecast metabolic outcomes with real accuracy.
A 2022 review in Frontiers in Nutrition concluded that baseline gut microbiota configurations can predict individual responses to weight loss diets, and argued explicitly for abandoning the one diet fits all concept in favour of microbiota informed personalization (Hernandez-Calderon et al., Frontiers in Nutrition, 2022).
Your bathroom habits, your post meal sensations, and your microbial patterns are not random biological noise. They are signals. Here are fifteen worth learning to read.
Signal 1: Microbial Diversity Levels
The most robust predictor of long term weight management success may be hiding in the sheer variety of bacteria in your gut.
In 1,632 healthy twins from the TwinsUK cohort followed over roughly nine years, higher gut microbiome diversity was independently correlated with lower long term weight gain, after adjusting for calorie intake and other confounders (Menni et al., International Journal of Obesity, 2017).
In a 2013 Nature analysis of 292 Danish adults, about 23 percent carried a low bacterial gene count, and those individuals showed more marked adiposity, insulin resistance, dyslipidaemia and inflammation than high richness individuals (Le Chatelier et al., Nature, 2013).
Studies of twins discordant for obesity make the causal case harder to dismiss. When researchers transplanted faecal microbiota from twin pairs discordant for obesity into germ free mice, the mice receiving the obese twin's microbiota gained significantly more adiposity than those receiving the lean twin's, on identical diets (Ridaura et al., Science, 2013). An earlier study of 154 individuals including monozygotic and dizygotic twin pairs found obesity was associated with reduced bacterial diversity (Turnbaugh et al., Nature, 2009).
What this means for you: If you struggle with weight despite reasonable eating patterns, low microbial diversity may be part of the picture. Strategies to build diversity include eating 30 or more different plant foods weekly, adding fermented foods, and minimizing unnecessary antibiotic exposure.
Signal 2: Stool Consistency Patterns
The Bristol Stool Scale is not just a clinical curiosity. It is a window into your metabolic machinery, and yes, this is the part of my job where I get genuinely enthusiastic about poop.
In the Flemish Gut Flora Project, stool consistency measured on the Bristol scale was the single strongest covariate of gut microbiota composition, correlating with microbial richness, enterotype and estimated bacterial growth rates (Vandeputte et al., Gut, 2016). Looser stool tracked with lower richness and a faster growing community. In the same population level dataset, stool consistency ranked among the top explanatory variables for microbiome variation across 1,106 individuals (Falony et al., Science, 2016).
These patterns matter because transit time directly affects nutrient absorption and microbial fermentation, and because dietary fibre modulates transit in ways that feed back on glucose homeostasis (Muller et al., Nutrients, 2018).
Predictive signal: Consistently seeing Bristol Type 3 to 4 stools correlates with healthy transit time and favorable metabolic outcomes. Chronic deviation toward either extreme suggests digestive dysfunction worth addressing.
Signal 3: Akkermansia muciniphila Abundance
If you had to bet on a single bacterial species predicting weight management success, Akkermansia muciniphila would be the smart money.
This mucin degrading bacterium lives in the intestinal mucus layer and typically makes up roughly 1 to 5 percent of the microbial community in healthy adults. Its abundance inversely correlates with body weight, obesity, untreated type 2 diabetes, and hypertension across multiple studies.
A 2013 study in PNAS demonstrated that A. muciniphila abundance decreased in obese and diabetic mice, and that administering the bacterium reversed high fat diet induced fat mass gain, metabolic endotoxemia and insulin resistance, partly by restoring the mucus layer thickness (Everard et al., PNAS, 2013). Mouse work confirmed the inverse relationship with inflammation and altered adipose metabolism (Schneeberger et al., Scientific Reports, 2015).
In humans, 49 adults with overweight or obesity undergoing calorie restriction showed that higher baseline A. muciniphila predicted healthier metabolic status at baseline and greater improvement in insulin sensitivity and body fat distribution after the intervention (Dao et al., Gut, 2016).
A 2019 proof of concept trial randomized 40 overweight, insulin resistant volunteers to placebo, live A. muciniphila, or pasteurized A. muciniphila at 10 to the power of 10 bacteria daily for three months, with 32 completing. Pasteurized A. muciniphila improved insulin sensitivity by 28.6 percent, reduced insulinemia by 34.1 percent, and lowered plasma total cholesterol by 8.7 percent compared with placebo (Depommier et al., Nature Medicine, 2019). The pasteurized form outperformed the live one, which was not what anyone expected.
The predictive pattern: Higher baseline A. muciniphila abundance correlates with better weight management outcomes. Low levels may indicate compromised barrier function and metabolic inflammation.
Signal 4: Short Chain Fatty Acid Production
Your gut bacteria are not passive tenants. They actively produce metabolites that influence appetite and fat storage.
Short chain fatty acids (SCFAs), particularly acetate, propionate, and butyrate, are produced when beneficial bacteria ferment dietary fiber. They fuel intestinal cells, help regulate fat metabolism, and influence satiety hormones.
The strongest human causal evidence comes from targeted delivery. In a 24 week randomized trial, 60 adults with overweight took either 10 g per day of inulin propionate ester, which releases propionate directly in the colon, or 10 g per day of inulin alone. The propionate group showed significantly reduced weight gain, less intra abdominal adipose tissue, lower intrahepatocellular lipid and preserved insulin sensitivity. A single acute 10 g dose raised postprandial PYY and GLP-1 and reduced energy intake at a subsequent meal (Chambers et al., Gut, 2015).
What to look for: Indicators of healthy SCFA production include regular, well formed bowel movements, absence of excessive gas after fiber, and sustained energy between meals. Low production tends to show up as fiber intolerance, erratic energy, and persistent hunger despite adequate food.
Signal 5: Post Meal Satiety Response
How you feel after eating provides real information about your gut hormone signaling.
The gut secretes more than 30 regulatory peptide hormones. Several, including GLP-1 and PYY, are directly involved in appetite control and are released after meals to mediate satiety. Bariatric surgery patients show markedly increased postprandial GLP-1 and PYY, which is thought to explain a large share of their sustained appetite suppression (De Silva and Bloom, Gut and Liver, 2012).
The predictive direction runs the other way too. People with poorer postoperative weight loss show elevated ghrelin and reduced GLP-1 and PYY secretion compared with better responders.
Predictive signal: Notice whether meals produce genuine satisfaction lasting 3 to 4 hours, or whether hunger returns early and refuses to settle. Impaired satiety signaling predicts greater difficulty with weight management.
Signal 6: Gut Barrier Integrity
Your intestinal lining is a single cell thick barrier separating trillions of bacteria from your bloodstream. When it weakens, the effects ripple through your metabolism.
Increased permeability allows bacterial lipopolysaccharide (LPS) to enter circulation. Continuous low dose LPS infusion in mice, at concentrations reachable through a high fat diet, was by itself sufficient to induce weight gain, fasting hyperglycaemia and insulin resistance. The authors named the state metabolic endotoxemia (Cani et al., Diabetes, 2007).
The reverse also holds. In women with obesity, four weeks of an 800 kcal per day very low calorie diet produced a mean weight loss of 6.9 kg alongside significant reductions in high sensitivity C-reactive protein and lipopolysaccharide binding protein, and decreased gut paracellular permeability measured by three independent methods (Ott et al., Scientific Reports, 2017).
Warning signs: Sensitivity to multiple foods, systemic inflammation without a clear cause, difficulty losing weight despite restriction, and metabolic markers that worsen even as effort increases.
Signal 7: Microbiome Plasticity
Some people's gut bacteria shift readily in response to dietary change. Others seem stubbornly fixed. That plasticity itself appears predictive.
The DIETFITS study followed 609 adults with overweight or obesity on either a healthy low carbohydrate or healthy low fat diet for 12 months. The microbiota proved strikingly resilient overall, with no bacterial signature consistently associated with weight loss across arms. However, gut microbiota plasticity, meaning the variability of an individual's microbiome over time before the diet started, correlated with 12 month weight loss in a diet dependent way (Fragiadakis et al., American Journal of Clinical Nutrition, 2020).
Baseline functional gene content also carries signal. Analysis of a healthy lifestyle intervention found that specific baseline metagenomic functional gene signatures, particularly genes for mucin degradation and complex polysaccharide breakdown, were associated with variable weight loss responses (Diener et al., mSystems, 2021). A separate metagenomic study of non surgical weight loss identified baseline patterns, including Alistipes abundance, that distinguished long term successes from regainers (Bischoff et al., Nutrients, 2022).
What this means: If your digestion responds noticeably when you change your diet, whether in bowel habits, gas patterns, or energy, that suggests higher plasticity and potentially better responsiveness. A gut that seems indifferent to dietary change may need longer or more targeted strategies.
Signal 8: Gastrointestinal Transit Time
How quickly food moves through your digestive tract influences how many calories you absorb and how your bacteria behave.
The relationship is complex rather than linear. A review of transit time, glucose homeostasis and metabolic health concluded that dietary fibres modulate transit in ways that alter fermentation site, SCFA profile and postprandial glucose handling, and that both unusually fast and unusually slow transit carry metabolic costs (Muller et al., Nutrients, 2018). Slow transit gives bacteria more time and shifts fermentation toward protein derived metabolites in the distal colon.
The workable range: Normal gastric emptying takes roughly 2 to 5 hours and small bowel transit 2 to 6 hours, with colonic transit considerably longer and far more variable. Chronically slow transit may indicate a system tuned for calorie extraction rather than efficient elimination.
Signal 9: Prevotella to Bacteroides Ratio
Not all gut bacteria respond equally to the same diet, and your dominant bacterial pattern may determine which approach suits you.
In a 26 week randomized trial of 62 adults with increased waist circumference, participants with a high pre treatment Prevotella-to-Bacteroides ratio lost 3.15 kg more body fat (95 percent CI 1.55 to 4.76) on a high fibre New Nordic Diet than on an average Danish diet. Participants with a low ratio showed no such difference between diets (Hjorth et al., International Journal of Obesity, 2018).
That is one of the cleaner demonstrations in the whole field that a baseline microbial marker can predict which of two reasonable diets will work better for a given person.
Practical application: If high fiber approaches have repeatedly failed you, your bacterial pattern may not be well matched to that strategy. Experimenting with different macronutrient ratios while monitoring digestive response helps identify your better fit.
Signal 10: Bloating and Gas Patterns
Excessive bloating and gas are not just uncomfortable. They may signal bacterial imbalances that complicate weight management.
In a study analysing breath tests from 792 people, participants positive for both methane and hydrogen had significantly higher median BMI than those with normal breath, methane only or hydrogen only patterns (26.5 versus 24.0 to 24.2 kg per square metre), and significantly higher mean percent body fat (34.1 percent versus 27.5 to 28.3 percent) after controlling for age (Mathur et al., Journal of Clinical Endocrinology and Metabolism, 2013). The combined pattern signals colonization by Methanobrevibacter smithii.
Methane appears to slow the migrating motor complex, the rhythmic movement that pushes contents through the small intestine, allowing more time for absorption.
Warning pattern: Bloating and distension particularly paired with constipation may indicate methane producing overgrowth. This pattern often responds to targeted dietary modification, ideally with clinical guidance.
Signal 11: Inflammation Reflected in Digestive Symptoms
Chronic digestive symptoms often reflect underlying inflammation that works against metabolic health.
Low bacterial richness travels with a more pronounced inflammatory phenotype (Le Chatelier et al., 2013), and circulating LPS is elevated in people with type 2 diabetes, obesity and metabolic disease. The gut liver axis creates a feedback loop in which digestive dysfunction promotes metabolic disease, which further impairs digestive function.
Predictive pattern: Persistent digestive complaints, particularly a cluster of symptoms rather than one isolated issue, often indicate inflammatory processes that complicate weight management efforts.
Signal 12: Response to Fiber Intake
How your digestive system handles fiber reveals a great deal.
High microbiome diversity, high fiber intake, and specific bacterial species implicated in energy metabolism all correlate with lower long term weight gain independent of calorie intake (Menni et al., 2017).
The relationship is more nuanced than more fiber equals better outcomes, though. Individuals with low baseline gene richness showed the largest gains in richness from an energy restricted, high protein, high fibre diet, while high richness individuals had less room to move (Cotillard et al., Nature, 2013). Diverse ecosystems are healthier and also more stable, which means slower to change.
Self assessment: Gradual tolerance building with improved energy and bowel function suggests a responsive system. Persistent bloating or unchanged symptoms despite adequate fiber may mean the ecosystem needs rehabilitation before fiber focused strategies will land.
Signal 13: Circadian Digestive Patterns
Your gut has its own clock, and disrupting it undermines weight management.
Roughly 20 percent of commensal taxa show diurnal oscillations in abundance and activity, and disrupting those rhythms impairs host metabolic homeostasis (Thaiss et al., Cell, 2014). Feeding pattern, not only diet composition, drives those dynamics: time restricted feeding partially restored oscillations that a high fat diet had flattened (Zarrinpar et al., Cell Metabolism, 2014).
A controlled human crossover comparing daytime and late night eating found late eating produced physiological dysregulation and circadian misalignment accompanied by microbial dysbiosis (Ni et al., Molecular Nutrition and Food Research, 2019).
Healthy pattern: Regular morning bowel movements, consistent appetite through the day, and natural hunger reduction in the evening suggest aligned circadian digestive function.
Signal 14: Energy Levels After Meals
Post meal energy reflects the efficiency of your digestive and metabolic systems working together.
When digestion functions well, meals produce sustained energy without dramatic peaks and crashes. Persistent fatigue after eating may indicate blood sugar dysregulation, often related to gut hormone signaling or microbial imbalance.
The PREDICT 1 study measured postprandial glucose, insulin and triglyceride responses in 1,002 people and found large person to person variability to identical meals, only modestly explained by genetics (Berry et al., Nature Medicine, 2020). Gut microbiome composition was among the factors associated with those differences (Asnicar et al., Nature Medicine, 2021).
What to notice: Sustained energy for 3 to 4 hours after meals suggests effective digestion and stable blood sugar. Consistent fatigue or brain fog within 1 to 2 hours of eating points toward digestive dysfunction.
Signal 15: Hunger Authenticity
Not all hunger is created equal, and learning to distinguish genuine hunger from bacterially driven urges is a skill with metabolic consequences.
Gut bacteria influence food cravings through multiple mechanisms. They produce metabolites that affect brain chemistry, influence hormone secretion, and interact with vagal nerve signaling. A 2025 Nature Microbiology study identified a gut, liver and brain pathway in which Bacteroides vulgatus derived pantothenate stimulates GLP-1, which triggers hepatic FGF21 release and reduces sugar preference (Zhang et al., Nature Microbiology, 2025).
Assessment: Genuine hunger builds gradually, responds to any nutritious food, and resolves with a reasonable portion. Microbially driven hunger often shows up as a sudden, specific craving, usually for sugar or refined carbohydrate, and persists despite adequate food intake.
The Fifteen Signals at a Glance
| # | Signal | Favourable pattern | Unfavourable pattern | Anchor study |
|---|---|---|---|---|
| 1 | Microbial diversity | High richness and evenness | Low gene count (~23% of adults) | Menni 2017; Le Chatelier 2013 |
| 2 | Stool consistency | Bristol Type 3 to 4 | Chronic Type 1 to 2 or 6 to 7 | Vandeputte 2016 |
| 3 | Akkermansia abundance | Roughly 1 to 5% of community | Depleted | Dao 2016; Depommier 2019 |
| 4 | SCFA production | Good fibre tolerance, steady energy | Fibre intolerance, erratic energy | Chambers 2015 |
| 5 | Post meal satiety | Satisfaction holding 3 to 4 hours | Hunger returning within 1 to 2 hours | De Silva and Bloom 2012 |
| 6 | Gut barrier integrity | Low hsCRP and LBP | Elevated LPS and inflammatory markers | Cani 2007; Ott 2017 |
| 7 | Microbiome plasticity | Digestion visibly responds to diet change | No response to dietary modification | Fragiadakis 2020; Diener 2021 |
| 8 | Transit time | Gastric 2 to 5 h, small bowel 2 to 6 h | Chronically slow or very fast | Muller 2018 |
| 9 | Prevotella to Bacteroides | High ratio responds to high fibre | Low ratio, no fibre advantage | Hjorth 2018 (3.15 kg difference) |
| 10 | Bloating and gas | Normal fermentation, no distension | Methane plus hydrogen positive breath | Mathur 2013 (BMI 26.5 vs 24.0) |
| 11 | Inflammatory symptom cluster | Isolated, occasional symptoms | Persistent multi symptom cluster | Le Chatelier 2013 |
| 12 | Fibre response | Tolerance builds, function improves | Persistent bloating despite adequate fibre | Cotillard 2013 |
| 13 | Circadian digestive timing | Morning bowel movement, evening hunger drop | Night eating, erratic timing | Thaiss 2014; Ni 2019 |
| 14 | Post meal energy | Steady for 3 to 4 hours | Crash within 1 to 2 hours | Berry 2020; Asnicar 2021 |
| 15 | Hunger authenticity | Gradual, responds to any food | Sudden, specific, sugar directed | Zhang 2025 |
Putting the Signals Together
No single digestive signal tells the whole story. But patterns emerge.
Hypothetical scenario. As an illustrative scenario, imagine two people starting the same high fibre plan. The first has Bristol Type 4 stools most days, satiety that holds four hours, and noticeable digestive change whenever she alters her diet. The second reports Type 2 stools, bloating with distension, hunger returning within 90 minutes, and no perceptible change when she has tried new eating patterns before. On the sourced signals above, the first person shows the plasticity and fibre tolerance pattern associated with responsiveness. The second shows the constipation plus distension pattern associated with methane positivity and the low plasticity pattern associated with weaker dietary response. The same plan is a reasonable first move for the first person and a poor first move for the second, who would be better served addressing transit and fermentation tolerance first. No prediction about either person's outcome is implied.
People positioned for successful long term weight management typically show:
- High microbial diversity with adequate beneficial species
- Regular, well formed bowel movements in the Bristol Type 3 to 4 range
- Satiety that holds for 3 to 4 hours after meals
- Good fiber tolerance with healthy SCFA production
- Stable energy without post meal crashes
- Predictable, circadian aligned digestive timing
- Hunger signals that respond to nourishment
Those facing greater headwinds often show:
- Low diversity with depleted beneficial bacteria
- Irregular bowel habits, constipation, or chronic loose stools
- Impaired satiety with persistent hunger or cravings
- Fiber intolerance, excessive bloating, or gas
- Post meal fatigue, brain fog, or energy instability
- Erratic digestive timing and nighttime symptoms
- Intense cravings that override fullness signals
The encouraging part: unlike your genes, your gut microbiome is modifiable. The signals you are broadcasting today do not have to be the signals you broadcast next season. The wider strategy behind that shift is laid out in my guide to gut microbiome optimization for weight loss and digestive wellness.
From Signals to Action
Understanding these signals turns weight management from guesswork into something closer to a data driven practice.
Rather than starting with a diet and hoping, consider starting with assessment. Track your bowel habits, notice your satiety patterns, pay attention to energy and cravings. Those observations become the baseline from which personalized insights can be built.
Some signals respond quickly to dietary change. Others take weeks or months of consistency. Complex cases may warrant professional assessment of microbial composition and function.
Your digestive system is not just processing food. It is telling you something about how the next six months are likely to go. Learning to read it, and then to change it, may be the most durable weight management skill you develop.
Frequently Asked Questions
What are gut health biomarkers for weight loss, and can I check them at home?
Gut health biomarkers for weight loss include microbial diversity, stool consistency, transit time, SCFA production, and satiety response. Several are observable at home through consistent tracking of bowel habits, hunger patterns, and post meal energy. More detailed microbial and metabolite data requires testing or at-home monitoring technology.
Can my poop really predict whether a diet will work?
Stool consistency was the strongest single covariate of gut microbiota composition in the Flemish Gut Flora Project, correlating with richness, enterotype and bacterial growth rates across more than a thousand people. It reflects transit time, which in turn shapes fermentation and absorption. It is not a crystal ball, but it is a genuinely informative and completely free daily data point.
Why do I feel hungry again an hour after a full meal?
Early returning hunger often reflects impaired satiety hormone signaling, particularly GLP-1 and PYY, which are influenced by gut bacteria and fiber fermentation. A single 10 g dose of colonic propionate raised both hormones and reduced subsequent energy intake in a controlled trial. Low SCFA production and blood sugar swings produce the same pattern, so look at fiber intake and meal composition first.
Which digestive health signal matters most for weight management?
Microbial diversity has the strongest evidence base. In 1,632 twins followed over roughly nine years, higher diversity was independently correlated with lower long term weight gain after adjusting for calorie intake. Diversity also underpins several other signals on this list, including SCFA production and fiber tolerance.
How often should I track these digestive wellness signals?
Daily observation for two weeks establishes a useful baseline, after which weekly review is usually enough. The goal is spotting patterns rather than reacting to single days. Passive at-home monitoring makes this easier by capturing data continuously instead of relying on memory and manual logging.
Does a bacterial marker really predict which diet will work for me?
In at least one case, yes. In a 26 week randomized trial of 62 adults, participants with a high Prevotella-to-Bacteroides ratio lost 3.15 kg more body fat on a high fibre diet than on a standard diet, while low ratio participants showed no difference between the two. That is a specific, replicated direction rather than a general promise, and it applies to fibre rather than to diets in general.
References
- Hernandez-Calderon P, et al. The microbiota composition drives personalized nutrition: Gut microbes as predictive biomarkers for the success of weight loss diets. Frontiers in Nutrition. 2022;9:1006747. doi:10.3389/fnut.2022.1006747
- Menni C, Jackson MA, Pallister T, et al. Gut microbiome diversity and high-fibre intake are related to lower long-term weight gain. International Journal of Obesity. 2017;41(7):1099-1105. doi:10.1038/ijo.2017.66
- Le Chatelier E, Nielsen T, Qin J, et al. Richness of human gut microbiome correlates with metabolic markers. Nature. 2013;500(7464):541-546. doi:10.1038/nature12506
- Ridaura VK, Faith JJ, Rey FE, et al. Gut microbiota from twins discordant for obesity modulate metabolism in mice. Science. 2013;341(6150):1241214. doi:10.1126/science.1241214
- Turnbaugh PJ, et al. A core gut microbiome in obese and lean twins. Nature. 2009;457(7228):480-484. doi:10.1038/nature07540
- Vandeputte D, et al. Stool consistency is strongly associated with gut microbiota richness and composition, enterotypes and bacterial growth rates. Gut. 2016;65(1):57-62. doi:10.1136/gutjnl-2015-309618
- Falony G, Joossens M, Vieira-Silva S, et al. Population-level analysis of gut microbiome variation. Science. 2016;352(6285):560-564. doi:10.1126/science.aad3503
- Muller M, et al. Gastrointestinal Transit Time, Glucose Homeostasis and Metabolic Health: Modulation by Dietary Fibers. Nutrients. 2018;10(3):275. doi:10.3390/nu10030275
- Everard A, Belzer C, Geurts L, et al. Cross-talk between Akkermansia muciniphila and intestinal epithelium controls diet-induced obesity. Proceedings of the National Academy of Sciences. 2013;110(22):9066-9071. doi:10.1073/pnas.1219451110
- Schneeberger M, et al. Akkermansia muciniphila inversely correlates with the onset of inflammation, altered adipose tissue metabolism and metabolic disorders during obesity in mice. Scientific Reports. 2015;5:16643. doi:10.1038/srep16643
- Dao MC, Everard A, Aron-Wisnewsky J, et al. Akkermansia muciniphila and improved metabolic health during a dietary intervention in obesity: relationship with gut microbiome richness and ecology. Gut. 2016;65(3):426-436. doi:10.1136/gutjnl-2014-308778
- Depommier C, Everard A, Druart C, et al. Supplementation with Akkermansia muciniphila in overweight and obese human volunteers: a proof-of-concept exploratory study. Nature Medicine. 2019;25(7):1096-1103. doi:10.1038/s41591-019-0495-2
- Chambers ES, Viardot A, Psichas A, et al. Effects of targeted delivery of propionate to the human colon on appetite regulation, body weight maintenance and adiposity in overweight adults. Gut. 2015;64(11):1744-1754. doi:10.1136/gutjnl-2014-307913
- De Silva A, Bloom SR. Gut Hormones and Appetite Control: A Focus on PYY and GLP-1 as Therapeutic Targets in Obesity. Gut and Liver. 2012;6(1):10-20. doi:10.5009/gnl.2012.6.1.10
- Cani PD, et al. Metabolic Endotoxemia Initiates Obesity and Insulin Resistance. Diabetes. 2007;56(7):1761-1772. doi:10.2337/db06-1491
- Ott B, et al. Effect of caloric restriction on gut permeability, inflammation markers, and fecal microbiota in obese women. Scientific Reports. 2017;7:11955. doi:10.1038/s41598-017-12109-9
- Fragiadakis GK, et al. Long-term dietary intervention reveals resilience of the gut microbiota despite changes in diet and weight. The American Journal of Clinical Nutrition. 2020;111(6):1127-1136. doi:10.1093/ajcn/nqaa046
- Diener C, et al. Baseline Gut Metagenomic Functional Gene Signature Associated with Variable Weight Loss Responses Following a Healthy Lifestyle Intervention in Humans. mSystems. 2021;6(5):e00964-21. doi:10.1128/mSystems.00964-21
- Bischoff SC, et al. Gut Microbiota Patterns Predicting Long-Term Weight Loss Success in Individuals with Obesity Undergoing Nonsurgical Therapy. Nutrients. 2022;14(15):3182. doi:10.3390/nu14153182
- Hjorth MF, et al. Pre-treatment microbial Prevotella-to-Bacteroides ratio, determines body fat loss success during a 6-month randomized controlled diet intervention. International Journal of Obesity. 2018;42(3):580-583. doi:10.1038/ijo.2017.220
- Mathur R, et al. Methane and Hydrogen Positivity on Breath Test Is Associated With Greater Body Mass Index and Body Fat. The Journal of Clinical Endocrinology & Metabolism. 2013;98(4):E698-E702. doi:10.1210/jc.2012-3144
- Cotillard A, Kennedy SP, Kong LC, et al. Dietary intervention impact on gut microbial gene richness. Nature. 2013;500(7464):585-588. doi:10.1038/nature12480
- Thaiss CA, Zeevi D, Levy M, et al. Transkingdom Control of Microbiota Diurnal Oscillations Promotes Metabolic Homeostasis. Cell. 2014;159(3):514-529. doi:10.1016/j.cell.2014.09.048
- Zarrinpar A, et al. Diet and Feeding Pattern Affect the Diurnal Dynamics of the Gut Microbiome. Cell Metabolism. 2014;20(6):1006-1017. doi:10.1016/j.cmet.2014.11.008
- Ni Y, et al. Late-Night Eating-Induced Physiological Dysregulation and Circadian Misalignment Are Accompanied by Microbial Dysbiosis. Molecular Nutrition & Food Research. 2019;63(24):1900867. doi:10.1002/mnfr.201900867
- Berry SE, Valdes AM, Drew DA, et al. Human postprandial responses to food and potential for precision nutrition. Nature Medicine. 2020;26(6):964-973. doi:10.1038/s41591-020-0934-0
- Asnicar F, Berry SE, Valdes AM, et al. Microbiome connections with host metabolism and habitual diet from 1,098 deeply phenotyped individuals. Nature Medicine. 2021;27(2):321-332. doi:10.1038/s41591-020-01183-8
- Zhang X, et al. Free fatty acid receptor 4 modulates dietary sugar preference via the gut microbiota. Nature Microbiology. 2025;10(2):348-361. doi:10.1038/s41564-024-01902-8
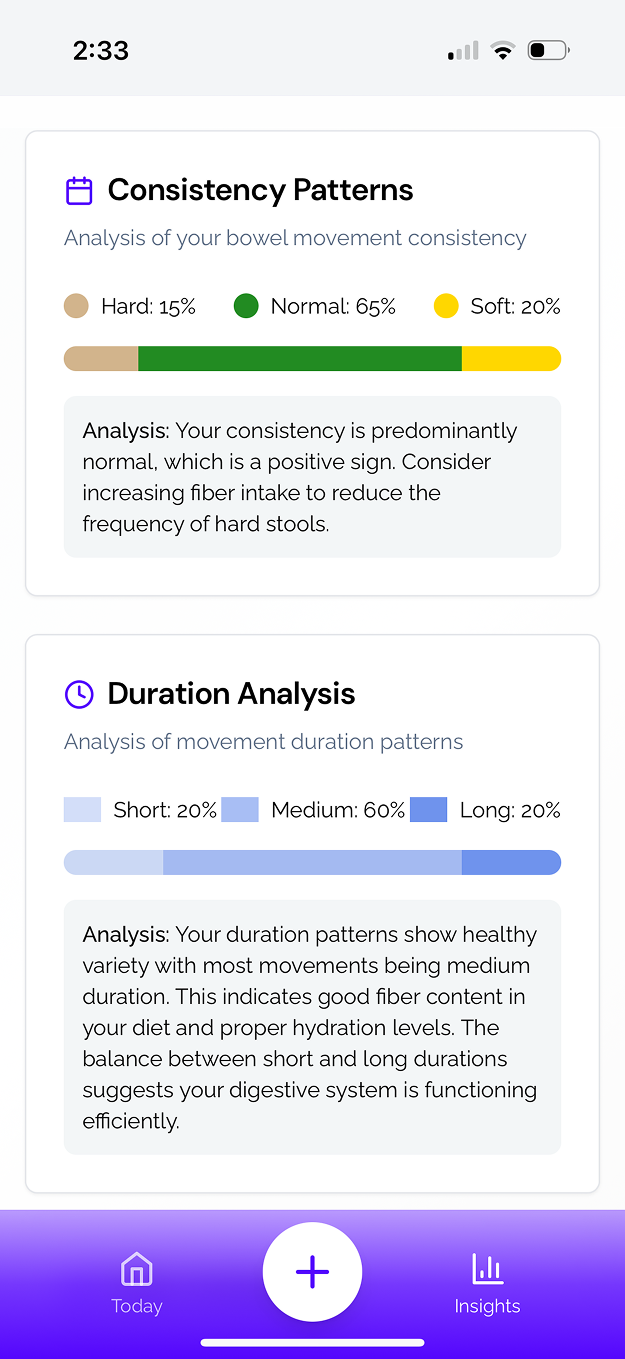
SNIFR is designed to provide insights about gut health patterns, not to diagnose or treat medical conditions. Individual results may vary as gut health is influenced by numerous factors including diet, stress, sleep, and genetics. SNIFR is currently in development, and features described may evolve before commercial release.
Other Posts



Be first to try SNIFR. Beta coming soon.
Join our waitlist to get notified when the app launches. Start understanding your gut health sooner.